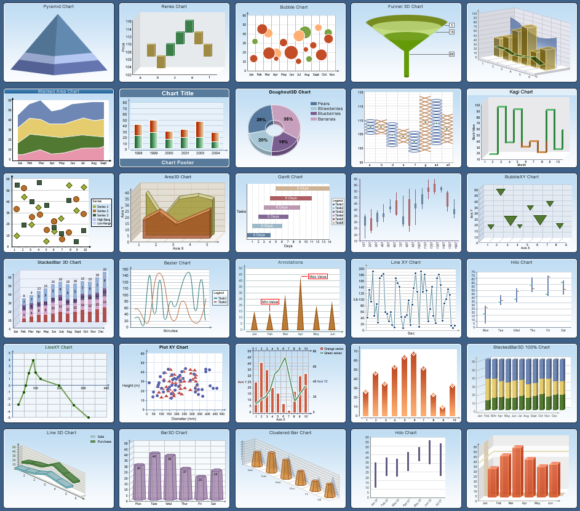
Are you a researcher looking for the best tools to visualise your research results, or an administrator eager to showcase the impact of your faculty’s work?
Since 2020, the Library has incorporated Data Visualisation as a service, as part of the division, Research Impact Services. This service has grown over the years to four workshops on the topic. If you need any assistance with visualising your data, a consultation service is also available. Libraries are taking on the role of data visualisation support worldwide. An article published in 2020 in the Journal of Interactive Technology and Pedagogy describes the library’s role in this regard: “As libraries already play a key role in advocacy for information literacy and ethics, they may also serve as unaffiliated, central places to gain basic competencies in associated information and data skills. Training patrons how to accurately analyze, assess, and create data visualizations is a natural enhancement to this role”.
The topics covered in these workshops vary from basic principles of data visualisation, an overview of tools available for effective data visualisation and introductory workshops on three of the tools, Microsoft Power BI, Tableau Public and Flourish. These workshops are general in nature and not directed towards specific types of visualisations used in different subject fields. The aim is also to introduce you to the tools for future self-exploration.
The workshop series on Data Visualisation for the year has concluded earlier in September. If you need access to the recordings of the workshops, you are very welcome to contact us. Or if you need one-on-one assistance, please make an appointment.
Contact: Marié Roux
Make an appointment for a consultation
Reference:
Aghassibake, Negreen; Jocque, Justin and Sisk, Matthew L. 2020. Supporting Data Visualization Services in Academic Libraries. Journal of Interactive Technology and Pedagogy. No 18.
Leave a Reply