Librarians often receive requests for information on the use of network visualisation tools, specifically for the visualisation of co-citation or co-authorship networks or journal co-citation networks. VOSViewer is a well-known tool that is used to create bibliometric network visualisations. There are other tools such Gephi and NodeXL, which could be very useful too. See more information about these three tools below:
VOSViewer
VOSViewer is a network visualisation tool specifically developed to aid in examining bibliometric networks, such as collaborations between researchers and relationships between publications. You can create numerous types of network visualisations with VOSViewer using data from different databases, such as Scopus, Web of Science, Dimensions, Crossref, OpenAlex, etc. The networks you create could include journals, researchers, or individual publications, and they can be constructed based on citation, bibliographic coupling, co-citation, or co-authorship relationships. VOSviewer also offers text mining functionality that can be used to construct and visualise co-occurrence networks of important terms extracted from a body of scientific literature.
Examples:

Collaboration between universities

Term co-occurrence network
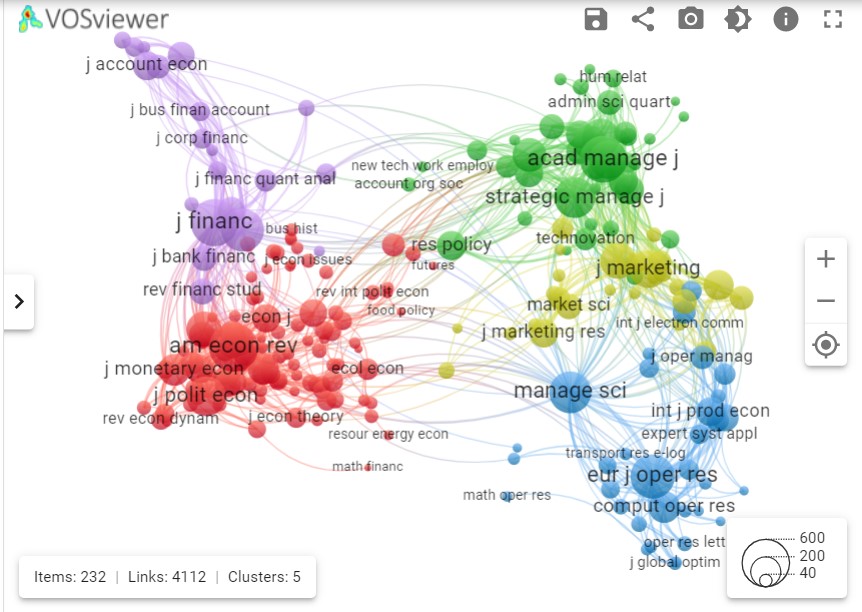
Journal co-citation network
For the analysis of an individual author, please remember that you can view VOSViewer visualisations for co-citations and co-author networks in the free version of the Dimensions database. See more information on this topic in a previous blog post.
Gephi
Gephi is a free, open-source desktop visualisation tool that specialises in visualising and analysing large network graphs. The following applications are available in Gephi.
Exploratory data analysis: Intuition-oriented analysis by network manipulations in real-time.
Link analysis: Revealing the underlying structures of associations between objects.
Social network analysis: Easy creation of social data connectors to map community organisations and small-world networks.
Biological network analysis: Representing patterns of biological data.
Poster creation: Scientific work promotion with high-quality printable maps.
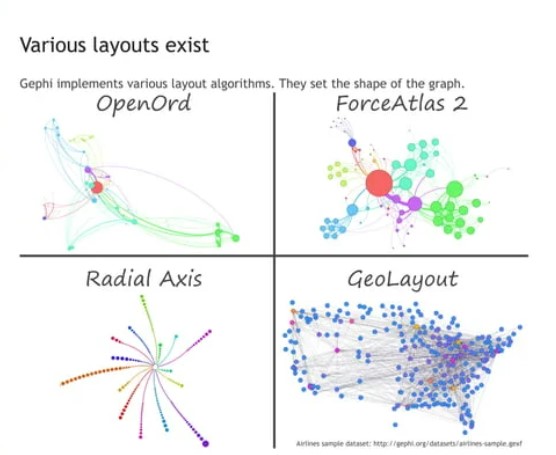
Various layouts in Gephi
NodeXL
NodeXL is an add-on to Microsoft Excel with a free plan. It allows you to create various node-link diagrammes using Excel spreadsheets. Unfortunately, it is only compatible with Microsoft Windows versions of Excel.
With the free and open NodeXL Basic , you can easily:
- Customize the network graph’s appearance
- Zoom, scale and pan the graph
- Calculate basic graph metrics
- Dynamically filter vertices and edges
- Alter the graph’s layout
- Find clusters of related vertices
The NodeXL Pro application adds additional features:
- Calculate advanced graph metrics
- Import and export graphs to a variety of file formats
- Get social networks using built-in connections to Twitter, Facebook, Flickr, YouTube, Wikis, Blogs, Instagram, Network Surveys, and email
- Automate network graph collection and creation
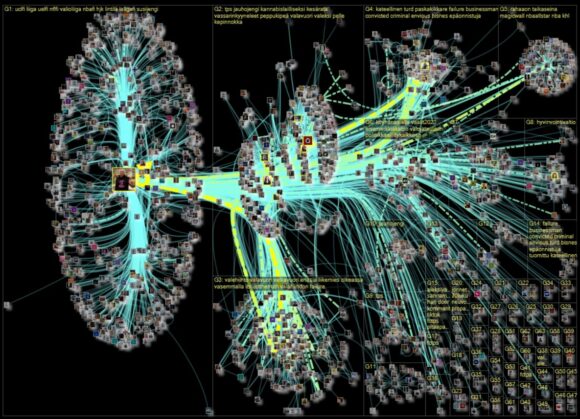
Example of a Twitter network analysis: The graph represents a network of 1 654 Twitter users whose recent tweets contained “valavuori OR valavuoren”, or who were replied to or mentioned in those tweets, taken from a data set limited to a maximum of 18 000 tweets.
Please contact Marié Roux for further assistance.