Did you know that the Library offers the following bibliometric reports to evaluate your research impact:
1. Basic metrics information
This report will include the H-Index from the different databases such as Scopus, Web of Science, Google Scholar, etc.
The information will be shared via e-mail or in Excel format.
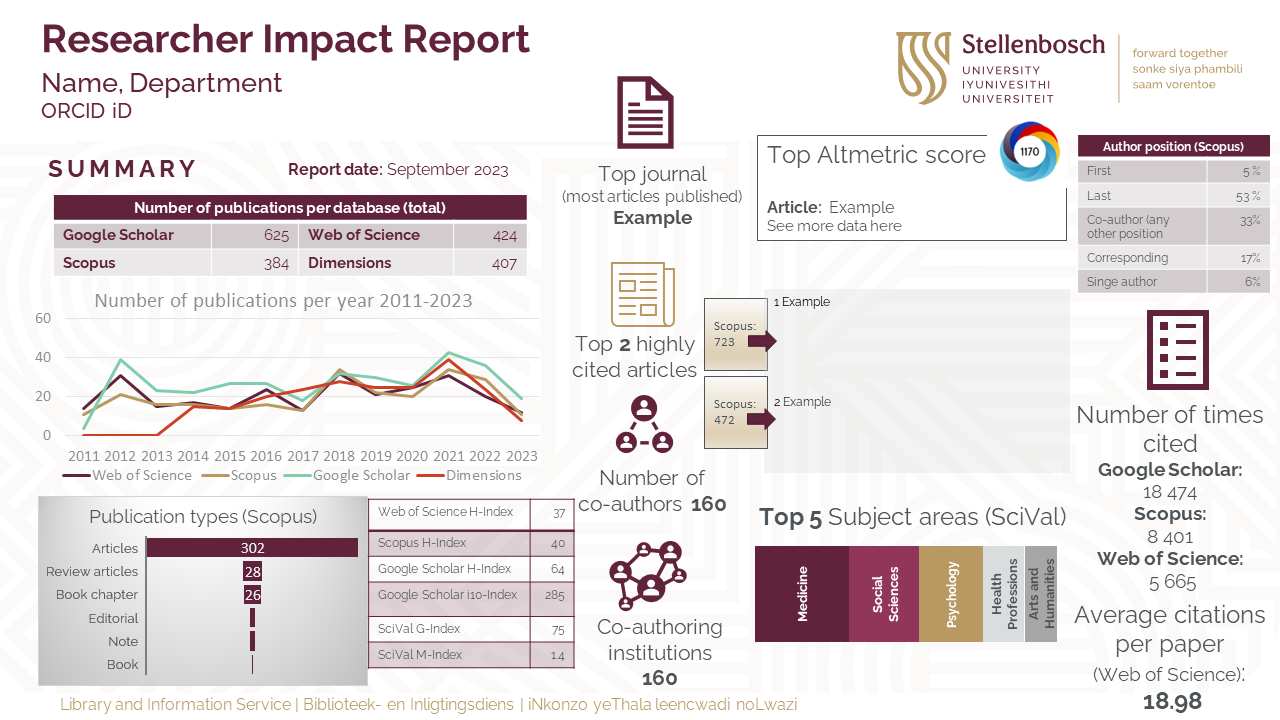
2. Full Researcher Impact Report
This full report will be in the format of a Microsoft PowerPoint slideshow which will include the following:
- A summary page that includes all the important metrics, such as the H-Index from different databases, the M-Index, the G-Index and other indices. The total publications and citations per year, and per database. Your top article in Altmetrics. The top 2 highly cited articles in Scopus or Web of Science and a few other important metrics.
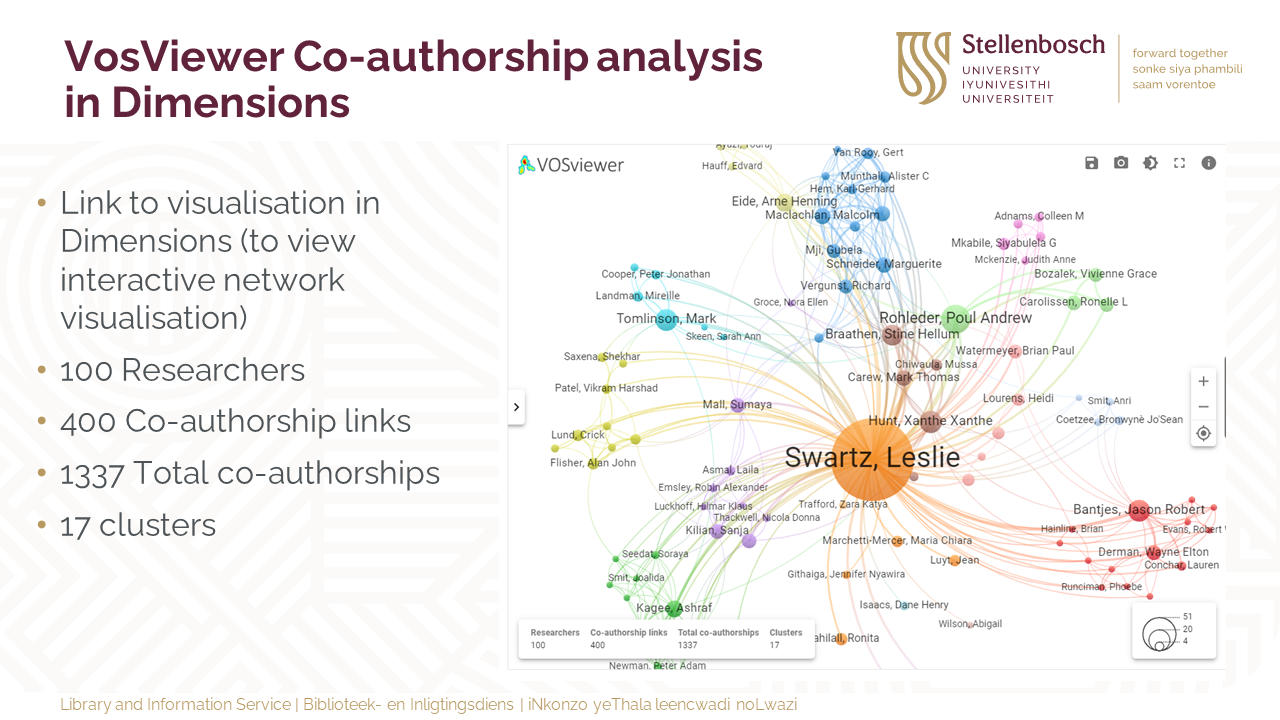
- VosViewer visualisation – Co-authorship analysis.
- VosViewer visualisation – Citations analysis.
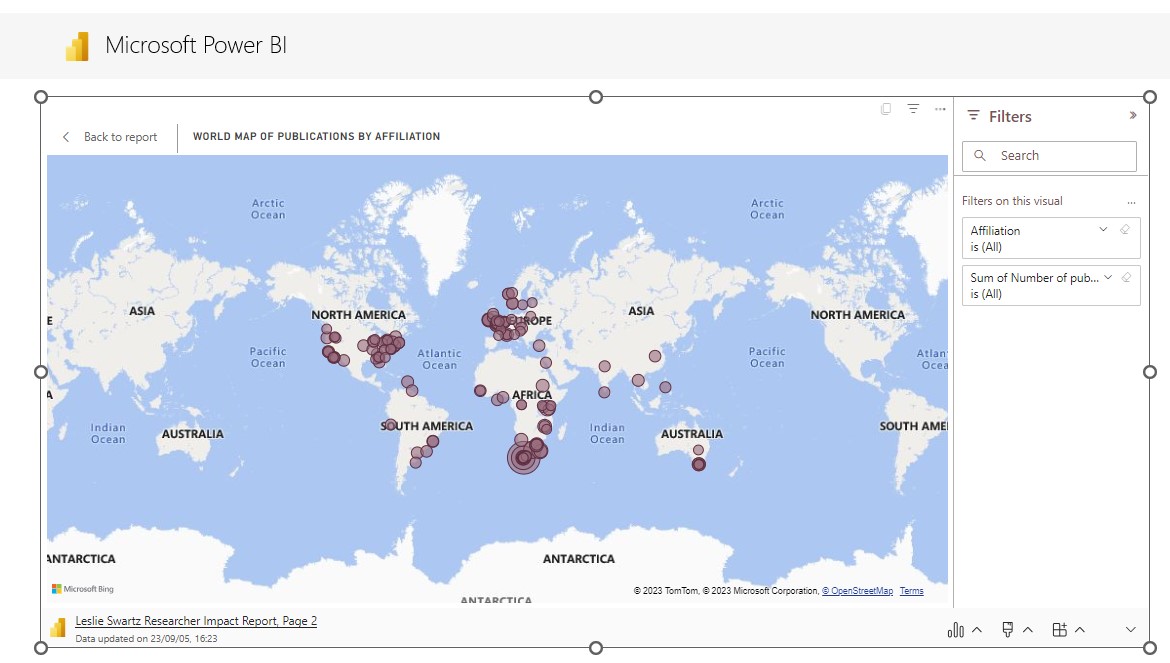
- PowerBi report which includes visualisations of all the important metrics related to your research output, from a specific database such as Scopus or Web of Science, depending on where most of your articles are indexed.
- Guidance on the responsible use of metrics.
- Methodology: Explanation of the tools used as well as links to your author profiles in the different databases.
- Glossary: Explanation of all the important terms used in the report.
The information will be shared in a PowerPoint template, including the PowerBi report embedded in PowerPoint. A link to the PowerBi report will also be shared as well as an Excel document with underlying data, including your top 50 articles in Altmetrics.
3. SciVal Reports
A range of different reports could be created by means of SciVal which is based on Scopus data. A specific date range will be chosen, of which the longest period is 10 years. A wide range of metrics are available.
Request your report from your Faculty Librarian or contact Marié Roux to coordinate the request.
Visit our Research Impact library guide for more information.