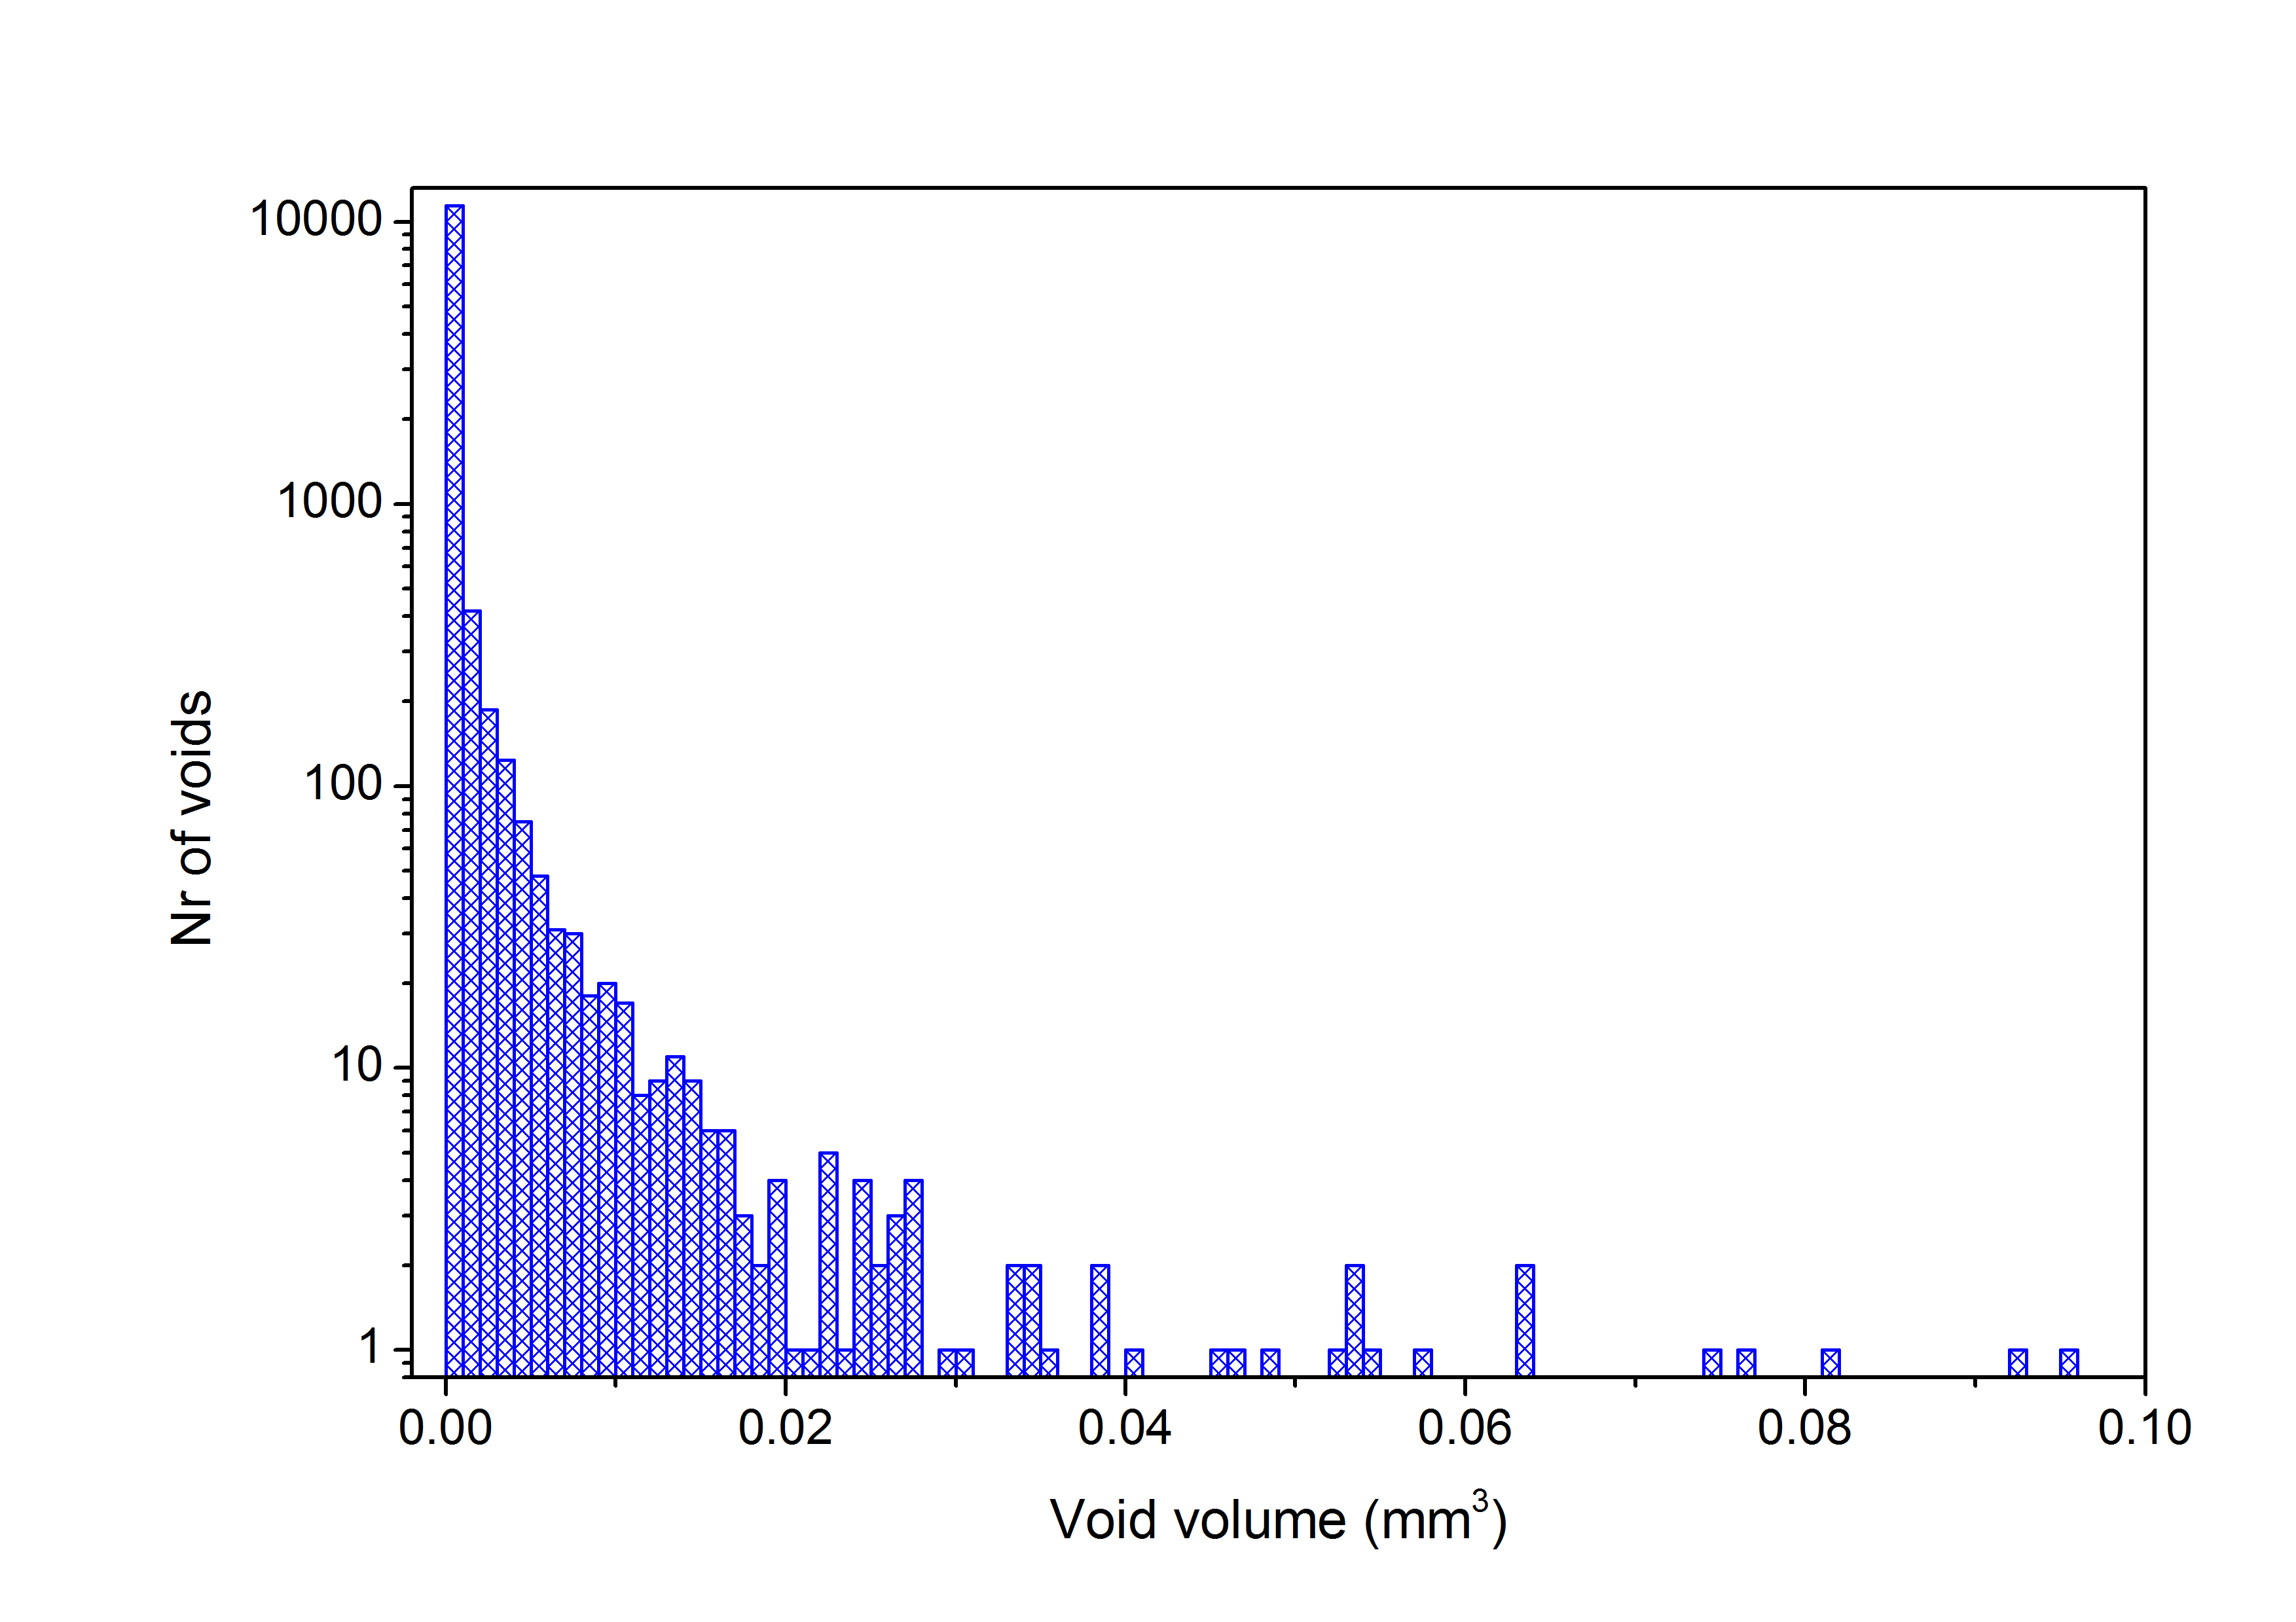
Porosity 3D visualization and quantification is made possible with good scan quality coupled with special software. This allows colour coding of voids (largest in red, smallest in blue) and even providing full porosity data such as void size distribution in the form of a histogram.
See below an image from a tensile specimen with total 0.43 % volumetric porosity, as well as a rotation movie of the same sample:
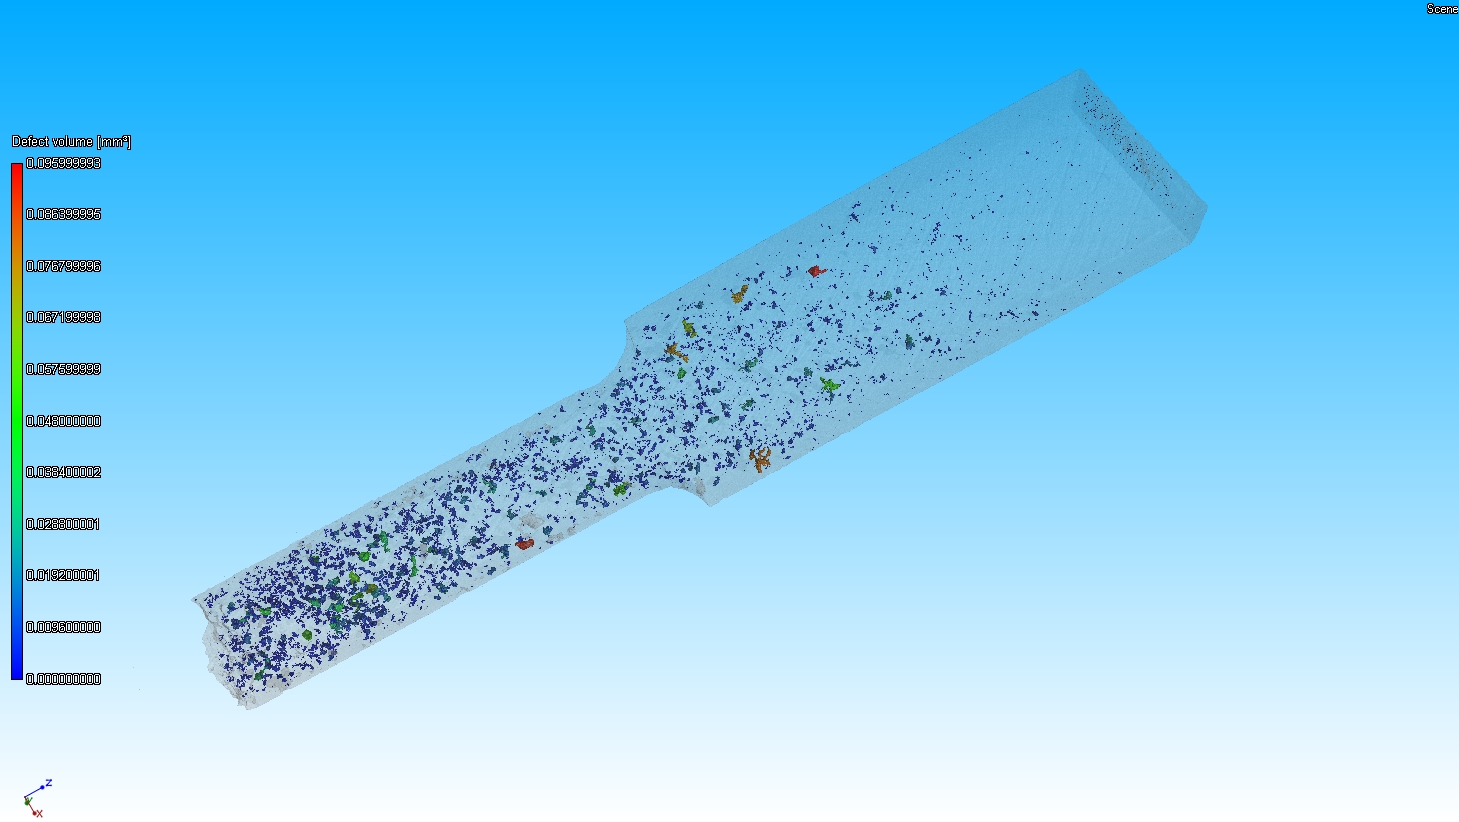
CLICK HERE FOR A 3D MOVIE OF THE ABOVE EXAMPLE: Tensile specimen rotation
 Follow