The porosity of samples can be visualized and analyzed with CT scans and automated defect analysis. In addition, new tools are available to do permeability analysis of very porous materials – that means to investigate how gas would flow through a rock, for example. This is especially important for oil & gas mining industries. We provide the scan and analysis service and can do method development projects also.
In this example a “slag” sample is shown, which contains both closed and open porosity of a wide size range. Slag is the remaining material left over after mineral processing. The images below show an automated defect analysis showing the voids colour coded according to size, and selecting only the largest pores for visualization in the last image
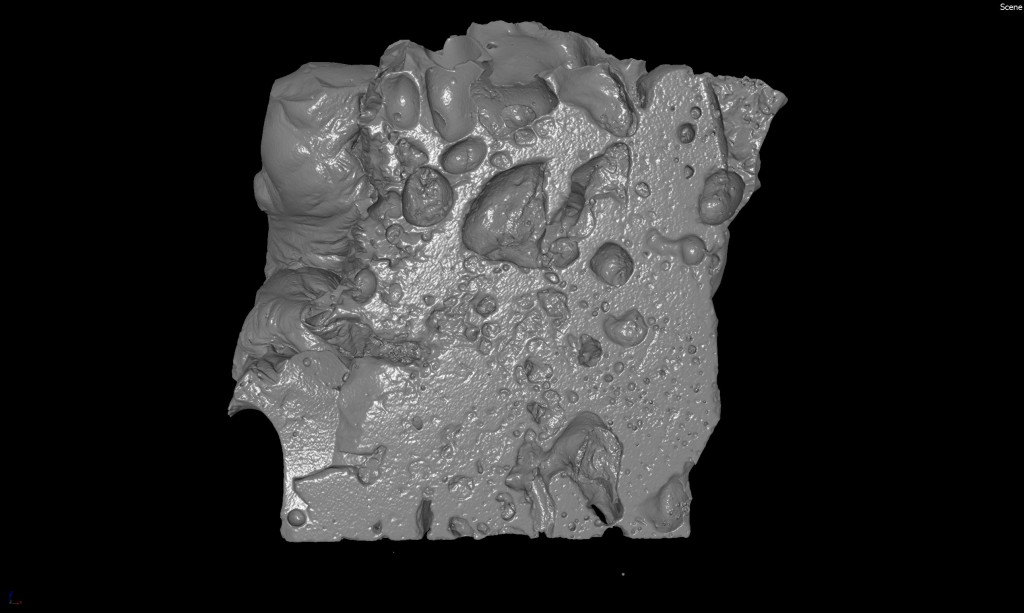
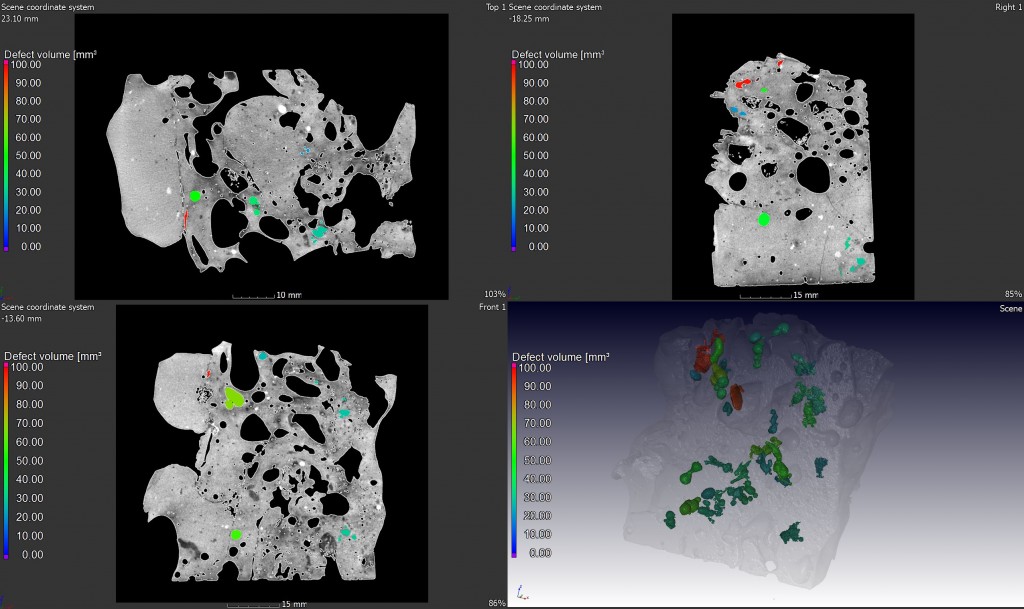
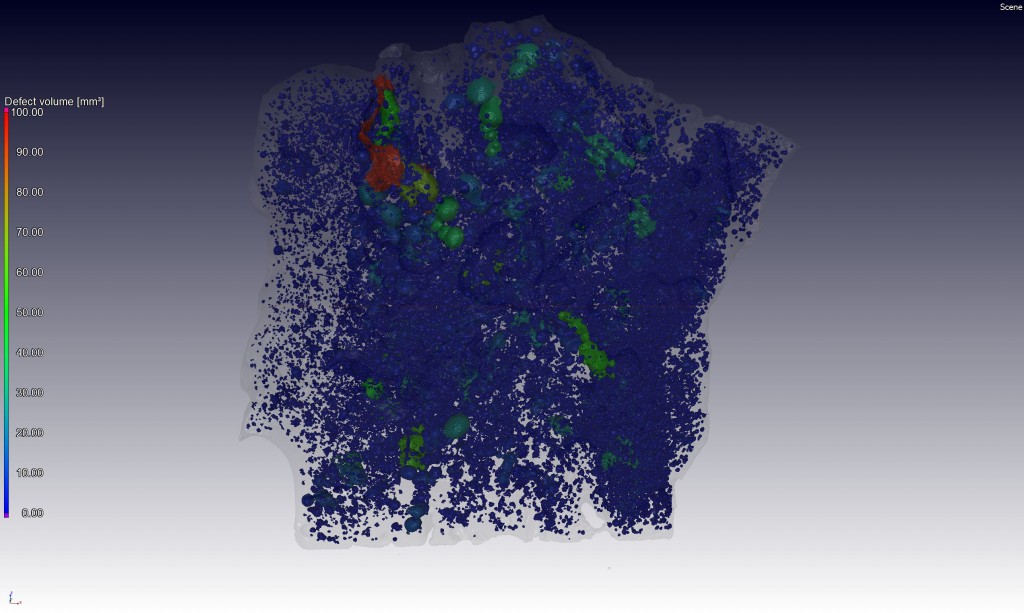
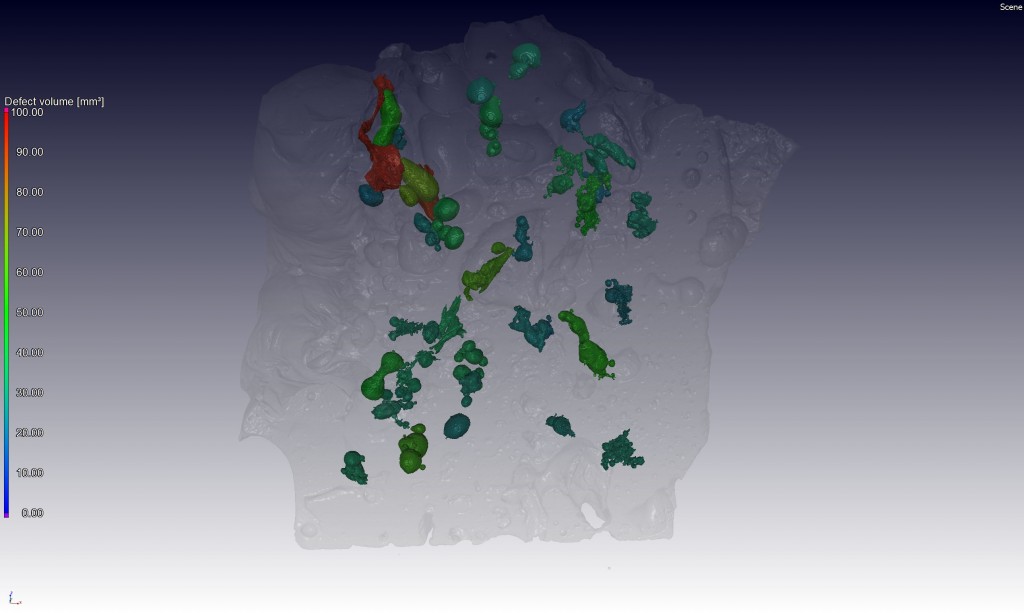
In this sample some dense particles are remaining in the slag, these are visualized as red particles below:
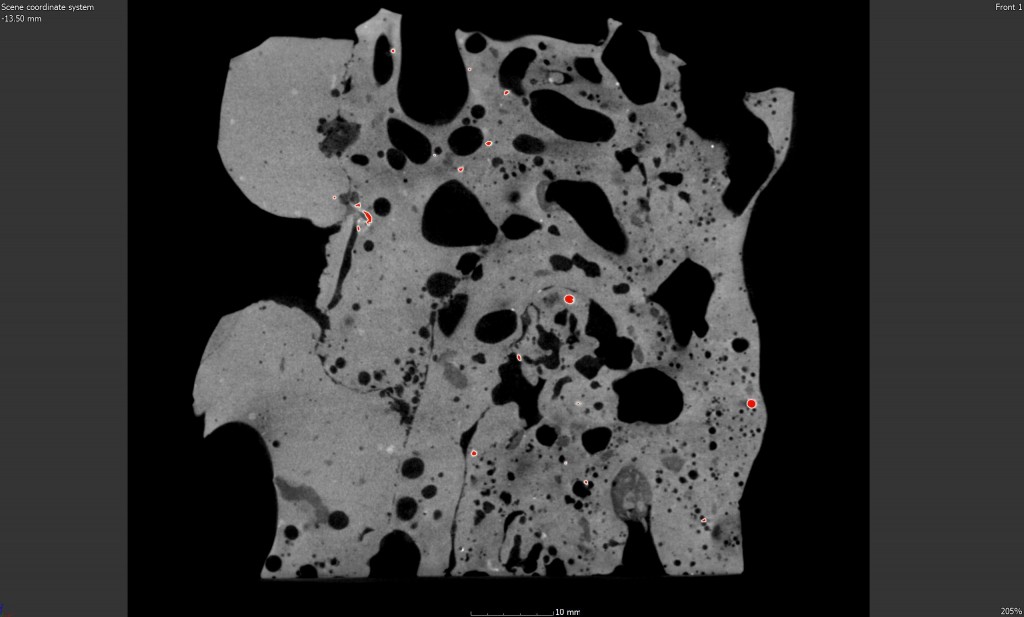
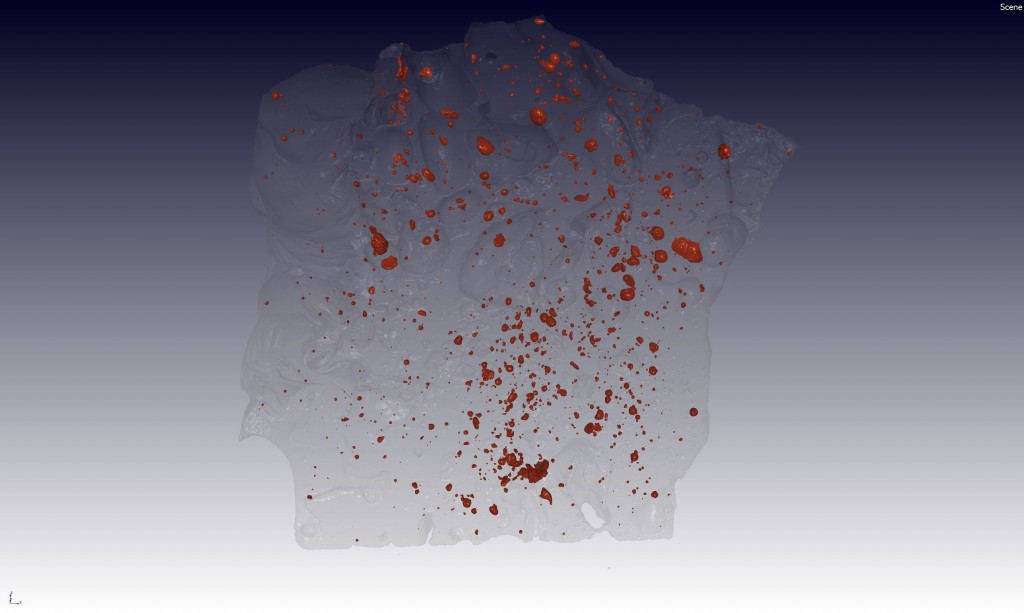
Permeability analysis is possible by virtually applying a gas pressure to one side of the sample, the pressure gradient and the gas flow through the sample can be visualized and the permeability can be calculated in 3D.
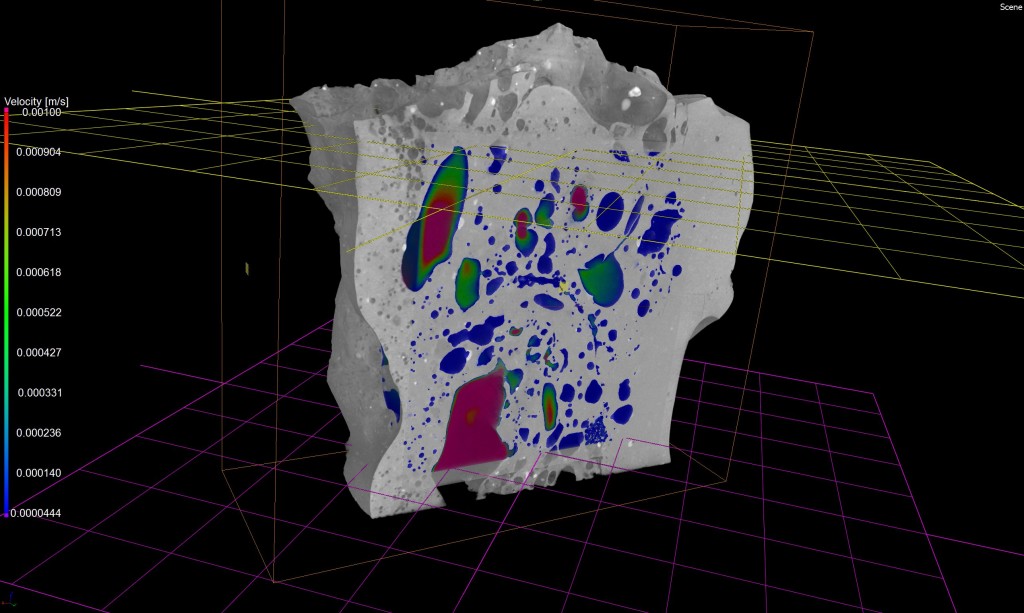
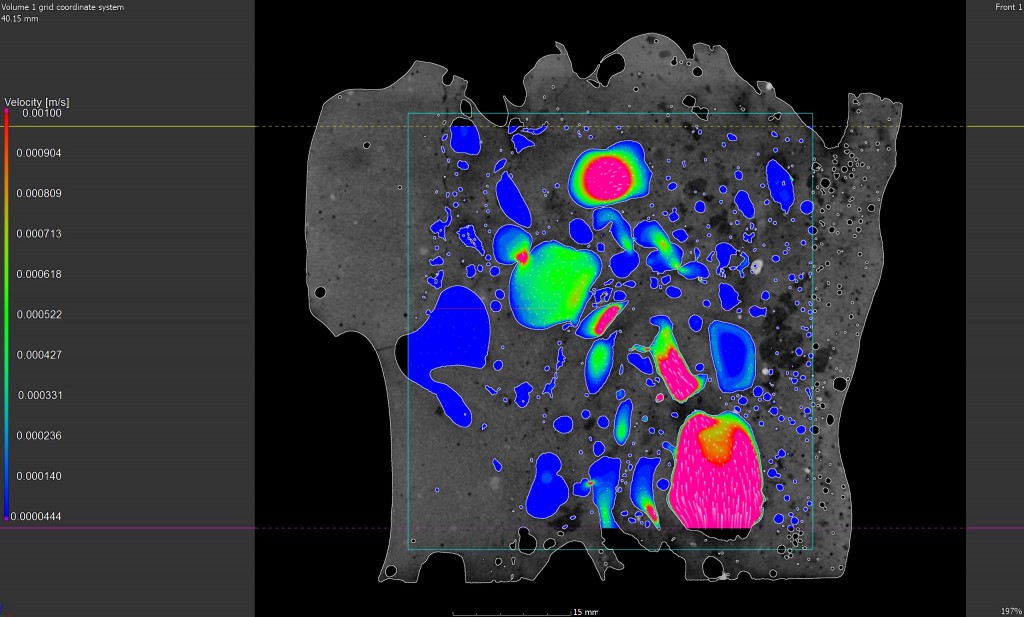
Check this video on youtube for this example:
https://www.youtube.com/watch?v=cWQQBo290ck
Analysis performed in VGStudioMax

 Follow