This post shows the type of analysis possible for commercial non-destructive testing customers, specifically to demonstrate what is possible and at what cost. Costs are excluding 7% admin fee and excluding VAT at 14%.
It is laid out in a step by step process, where a typical customer will make use of steps 1-3 while some will select all steps or others will select only steps 1,2 and possibly one more.
All scans are saved and provided with a free 3D viewer which includes analysis, eg. indicators and defect analyses are included in the data. The data is not stored in our facility for more than 2 weeks so data management is needed, we provide 1Tb hard drives or provide your own to be sent back with samples.
Here we lay out the steps and show examples based on a case study published in more detail (open access) here: http://www.sciencedirect.com/science/article/pii/S2214657115000040
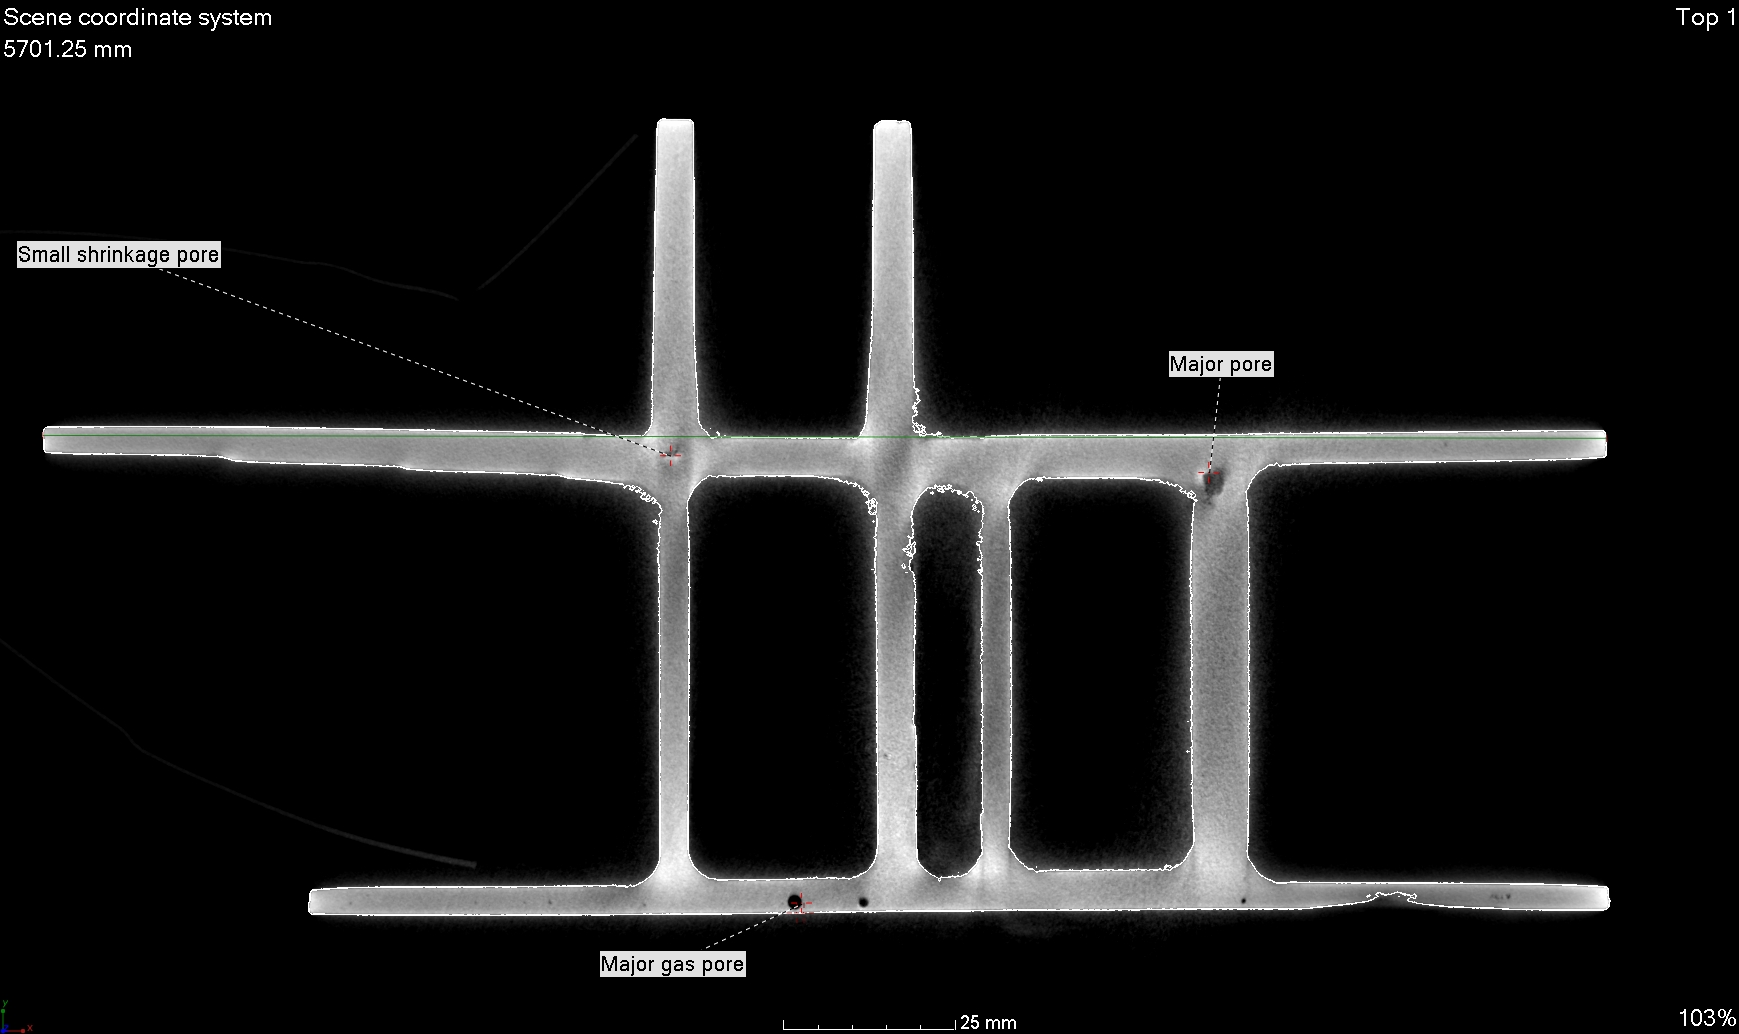
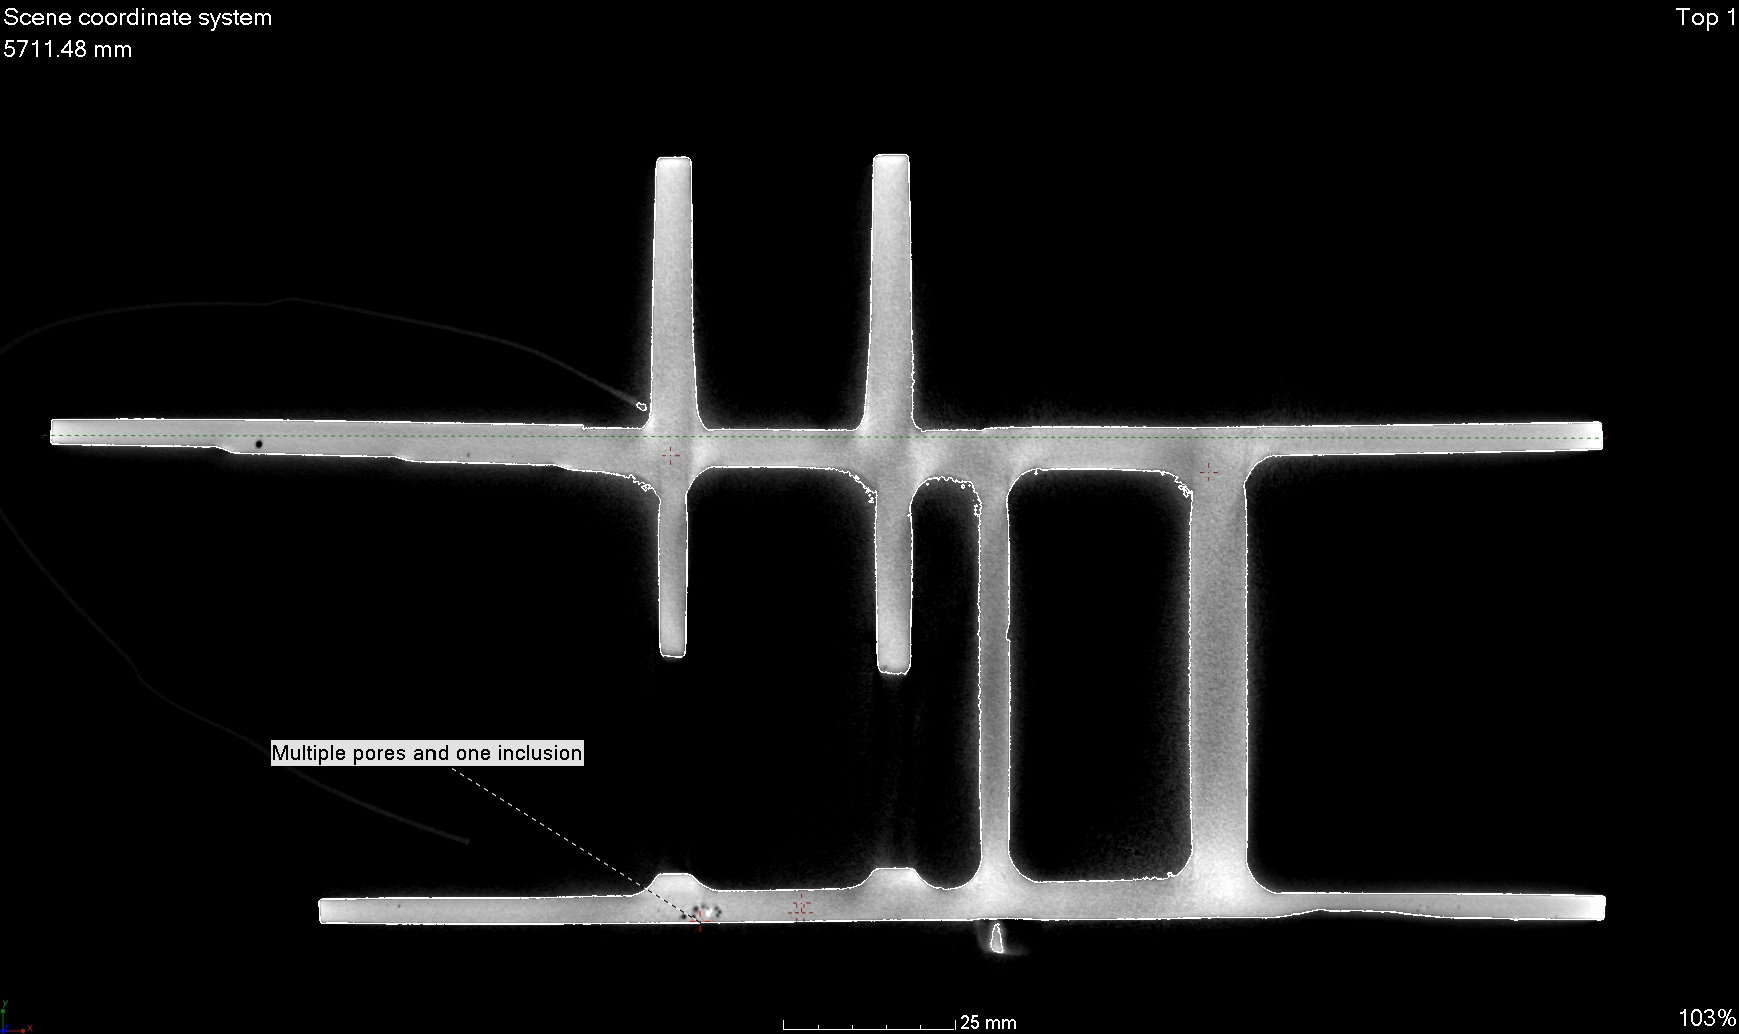
Step 1: High quality CT scan, typical R1300 depending on part size. Shown below is digital X-ray image, taken during CT scan. This example is a scan of a 225 mm titanium alloy sample at 0.16 mm resolution using settings as described in the publication

Step 2: Basic manual analysis – looking for and identifying defects, by placing indicators in the 3D data file or making slice image stack for self-viewing of slice images (or making STL file of the surfaces): R1300
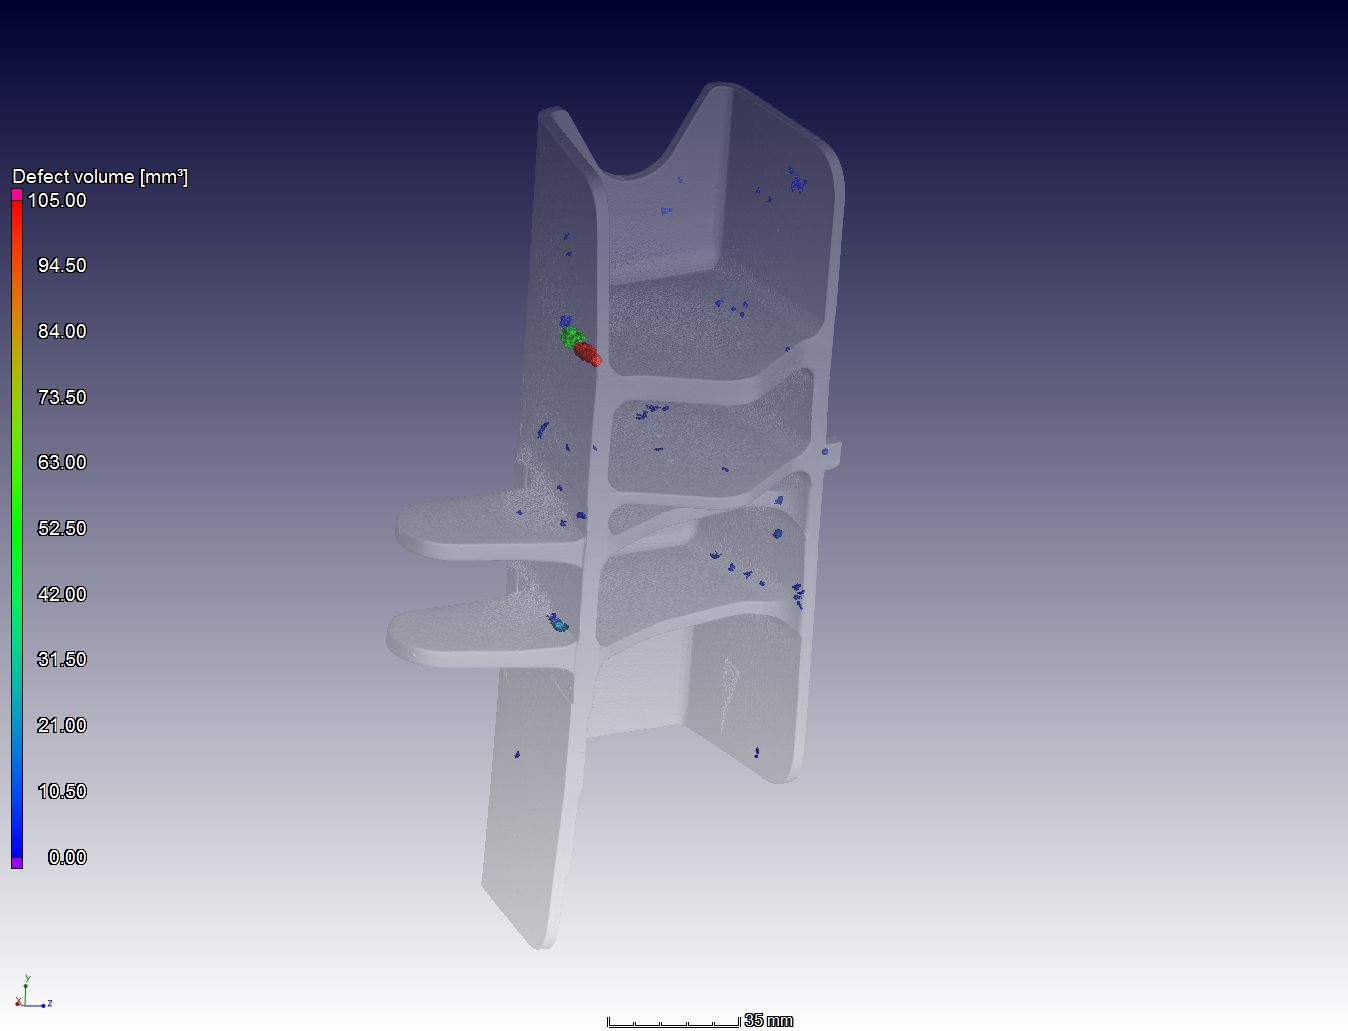
Step 3: Defect or inclusion analysis including pore/inclusion size distribution: R1300
Defect analysis shows defects in colour in 3D based on volume, full pore analysis is included in the analysis data, or it can be provided as CSV file. See here 3D image
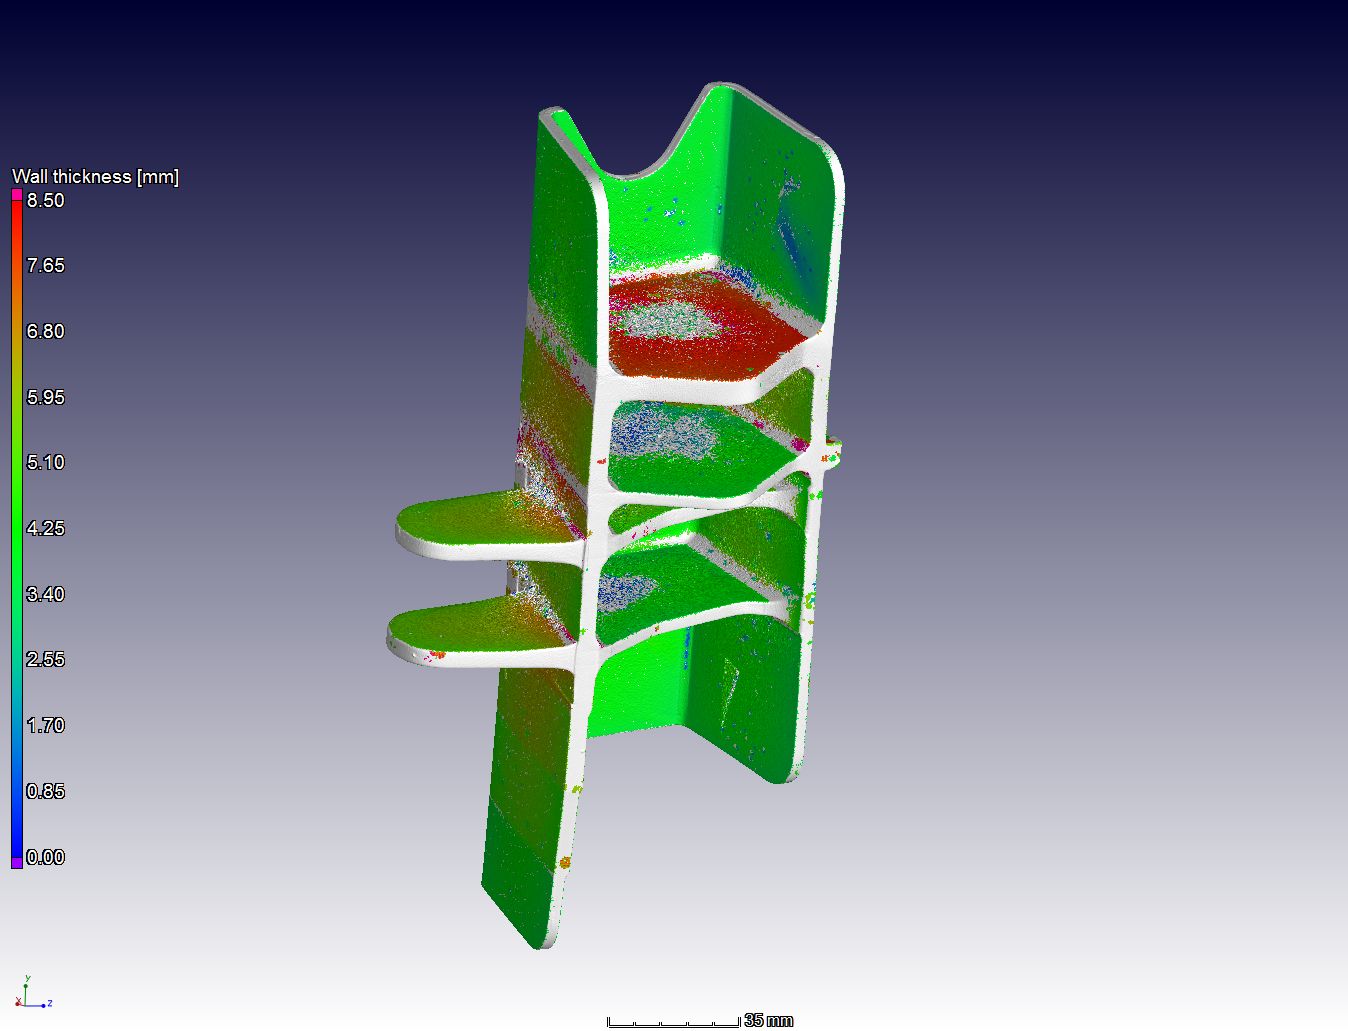
Step 4: Wall thickness analysis: R1300
Wall thickness analysis (can be useful for measuring coatings or layer thickness distributions)
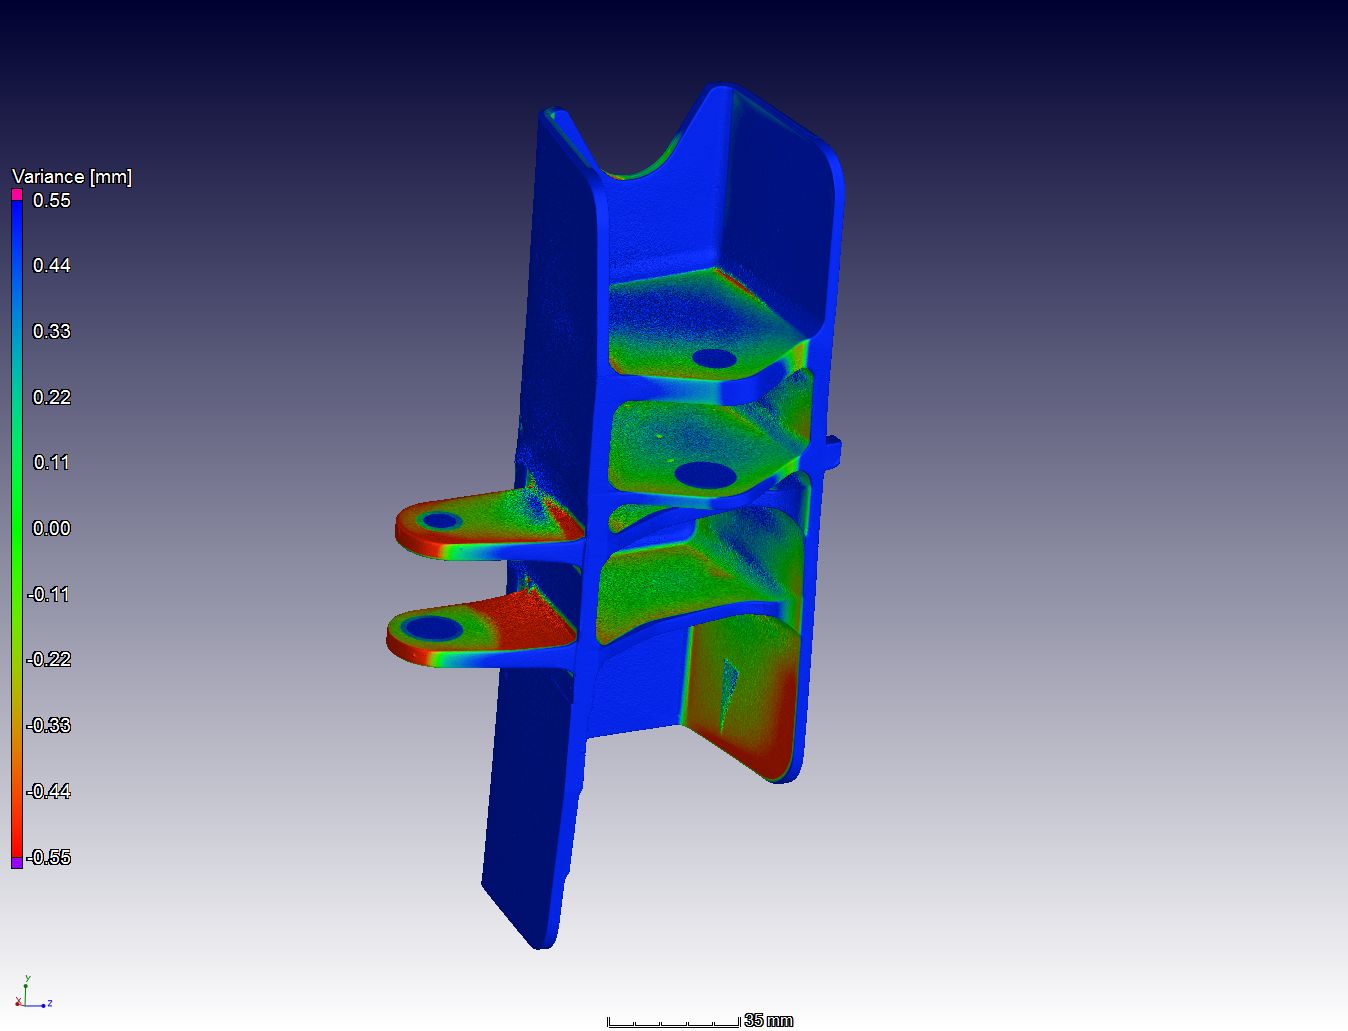
Step 5: Automated part-to-CAD comparison: R1300
Part-to-CAD comparison (or part to part comparison)
All steps up to this point were covered in the above listed publication. Further steps will be covered in more detail in a future publication but descriptions are given below
Step 6: Advanced image processing – this can include segmentation tasks like seperating different components and measuring the volumes of the different components: R1300
Step 7: Metrology – this can include measuring accurate distances between planes or diameters of cylindrical components. This step requires very well defined client requirements as it can become very time consuming: R1300 for typical 5 dimensional measurements using the metrology toolbox
Step 8: Report on findings, either automated inspection report or manual CT facility summary report R1300
Step 9: Sometimes an interesting feature needs scanning at higher resolution, which is possible when moving the sample closer than in step 1, overfilling the detector which can cause some kinds of image artefacts, but higher resolution is possible which allows viewing and resolving of smaller features. Sometimes multiple scans of the same object at higher resolution can be stitched together to make a large volume at higher resolution than typical in one scan alone. This increases the time by a factor 3 for a factor 2 resolution improvement. Eg. a scan of 85 microns is done at 40 microns in 3 parts, making the cost R3900 extra. We always do an artefact-free high quality scan as first step.
Step 10: After receiving your data and working with it, you can contact us for assistance in further analysis. Describe the requirements or mark regions of interest in the volume data set before sending the data to us. Analysis rates depend on analysis required.
 Follow