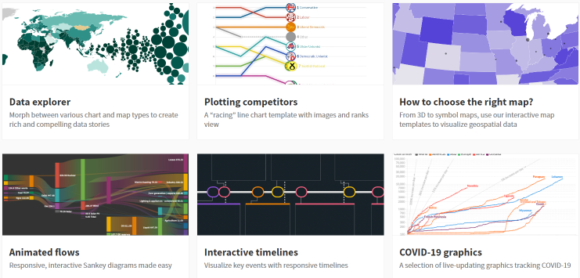
The generous free version of Flourish, is very helpful to gain data visualisation techniques and easily create visualisations.
What it does: Flourish is part of the Canva family and was created to enable anyone to tell stories with data. Launched in 2018, the tool is used by a large community. It has flexible templates, custom themes and a very user-friendly interface. It is also not just for visualisations, but you can create anything, from quizzes to carousels. The fact that it is integrated with Canva is also an advantage in the sense that it can import your visualisations into any new creation in Canva, such as powerpoint templates or infographics.
The #SmartResearcher webinar about Tableau Public and RawGraphs on 26 September will also touch on how to create visualisations with Flourish. Please book here!
Learn more: Help and resources / Blog

Leave a Reply